Relational data 4 - Challenges
Download exercises zip
Matrices
HOW TO DISPLAY: In these exercises you never need to display the chain exactly as in the examples, the important thing is having correct node numbers and links among them. Still, for optimal display we will sometimes suggest some options parameters.
First off, import draw_mat:
[1]:
from soft import draw_mat
Challenge - trichain
Write a function which given an odd number n, displays a graph represented as matrix of lists of lists of booleans as in the examples.
if
nis negative or even, raiseValueErrorFor optimal display call
draw_matlike this:draw_mat( mat , options={'graph':{'rankdir':'LR'}} )
Examples:
>>> trichain(3)

>>> trichain(5)

>>> trichain(7)

[2]:
from soft import draw_mat

def trichain(n):
    raise Exception('TODO IMPLEMENT ME !')


trichain(3)
trichain(5)
trichain(7)
Challenge - Bipartite
✪✪ Write a function which given two numbers n and m, displays a boolean matrix as list of lists, representing a graph in which first n nodes are linked to all successive m nodes.
for optimal drawing, add
optionsparameter like this:draw_mat( mat , options= {'graph':{'ordering':'out'}})
Examples:
>>> bipartite(2,4)

>>> bipartite(3,2)

[3]:
from soft import draw_mat

def bipartite(n, m):
    raise Exception('TODO IMPLEMENT ME !')


bipartite(2,4)
bipartite(3,2)

#bipartite(1,1)
#bipartite(1,2)
#bipartite(2,1)
Challenge - Luna park
✪✪ A luna park receives hordes of tourists who all want to have a ride on The Spinning Head. The attraction has many queues to get tickets, and each queue holds tourists identified by an id. The attraction operators take 5 minutes to service each tourist.
Implement a function lunapark which takes a list of queues (each queue is a list of ids), and displays a graph represented as matrix as a list of lists of integers, with the times tourists have to wait until they get served.
assume there are always \(n\) distinct tourists, with ids starting from \(0\) until \(n\) excluded
Example:
We have 4 queues, and in the first queue tourist 0 will have to wait 10 minutes and tourist 2 will have to wait 5 minutes. Tourist 7 is being serviced so she has zero minutes to wait.
tourists = [[0,2,7],
            [1,4,6,8],
            [3,5,14],
            [9,10,11,12,13]]
>>> lunapark(tourists)

[4]:
from soft import draw_mat

def lunapark(queues):
    raise Exception('TODO IMPLEMENT ME !')

tourists = [[0,2,7],
            [1,4,6,8],
            [3,5,14],
            [9,10,11,12,13]]


lunapark(tourists)

#lunapark([ [0] ])
#lunapark([ [0,1]])
#lunapark([ [0,1],
#           [2]])
Challenge - Factory
A factory has several conveyor belts to process raw materials. Each conveyor has a number of machines which refine the material. Each machine takes a different time to work, except the last one of each line which is just a collector.
Factory process
✪✪ Write a function process which takes a list of machine lines and displays a graph as a matrix of list of lists of integers holding the timings between each machine. A machine line is a list with the timings of each machine.
this time also RETURN the matrix (we will reuse it later)
Note node ids are implicit, you have to derive them
Example: the first line has 4 machines: the first takes 53 minutes, the second 65 and the third one 49 minutes and the last one is implicitly supposed to take zero minutes as it’s just a collector.
# station ids
>>> process( [ [53,65,49],   # 0  1  2  3     conveyor line 0
               [93],         # 4  5           conveyor line 1
               [25,39],      # 6  7  8        conveyor line 2
               [52],         # 9  10          conveyor line 3
               [28],         # 11 12          conveyor line 4
               [94] ] )      # 13 14          conveyor line 5

[5]:
from soft import draw_mat

def process(lines):
    raise Exception('TODO IMPLEMENT ME !')

                                   # station ids
processing_lines = [ [53,65,49],   # 0  1  2  3     conveyor line 0
                     [93],         # 4  5           conveyor line 1
                     [25,39],      # 6  7  8        conveyor line 2
                     [52],         # 9  10          conveyor line 3
                     [28],         # 11 12          conveyor line 4
                     [94],         # 13 14          conveyor line 5
                   ]


process(processing_lines)


#process([ [34] ])
#process([ [51,83] ])
#process( [ [55],
#           [92,41]])
Factory assemble
✪✪✪ After processing, each material part is assembled into intermediate products until the final product is made. Multiple conveyor lines can join into another ones for assembly. The joining time is always fixed to 5 minutes. Write a function assemble which given conveyor lines as before and a joins list displays a graph matrix as a list of lists of integers
HINT 1: you can call previous
process(lines)function and then connect the joinsto draw the graph horizontally, add the parameter
options={'graph':{'rankdir':'LR'}}todraw_mat
Example:
processing_lines = [               # station ids   conveyor line
                     [53,65,49],   # 0  1  2  3        0
                     [93],         # 4  5              1
                     [25,39],      # 6  7  8           2
                     [52],         # 9  10             3
                     [28],         # 11 12             4
                     [94] ]        # 13 14             5

# conveyor line 0,1 and 2 outputs must go into conveyor line 3 input in 5 minutes
# conveyor line 3 and 5 outputs must go into conveyor line 5 input in 5 minutes
joins = [(0,3), (1,3), (2,3), (3,5), (4,5)]

>>> draw_mat(assemble(processing_lines, joins), options={'graph':{'rankdir':'LR'}})

[6]:
from soft import draw_mat

def assemble(lines, joins):
    raise Exception('TODO IMPLEMENT ME !')

processing_lines = [               # station ids   conveyor line
                     [53,65,49],   # 0  1  2  3        0
                     [93],         # 4  5              1
                     [25,39],      # 6  7  8           2
                     [52],         # 9  10             3
                     [28],         # 11 12             4
                     [94] ]        # 13 14             5

# conveyor line 0,1 and 2 outputs must go into conveyor line 3 input in 5 minutes
# conveyor line 3 and 5 outputs must go into conveyor line 5 input in 5 minutes
joins = [(0,3), (1,3), (2,3), (3,5), (4,5)]

assemble(processing_lines, joins)


#assemble([ [23] ], [])
#assemble([ [23,81] ], [])
#t = [ [23],
#      [84,12] ]
#assemble(t, [(1,0)])
Challenge - Sharing is caring
✪✪ Given a number n of couples husband / wife, write a function sharing which displays a graph which models the relation can access property of. As output format use a matrix list of lists of booleans.
if
nis zero or negative, raiseValueError
Example:
mister
0can access his car and miss5’s carmiss
5can access her car and mister0’s car
>>> sharing(3)

[7]:
from soft import draw_mat

def sharing(n):
    raise Exception('TODO IMPLEMENT ME !')


sharing(3)


#sharing(1)
#sharing(0) # ValueError
Challenge - Hexagons
✪✪✪ Write a function hexagons(h) which displays a graph with h hexagons as in the example. As output format, use a matrix as list of lists of booleans.
WARNING: node
1is special, it doesn’t obey any pattern so treat it separatelyUse these options for optimal display:
draw_mat(mat, options={'graph':{'layout':'neato','scale':'0.9','start':'random6'}})NOTE: sometimes the layout is displayed garbled, in particular the first hexagon tends to be messy. If this happen, try to changing the number in
'random6'parameter with other numbers, like'random3','random4', etc.
Example:
>>>draw_mat(hexagons(5), options={'graph':{'layout':'neato','scale':'0.9','start':'random6'}})

[8]:
from soft import draw_mat

def hexagons(h):
    raise Exception('TODO IMPLEMENT ME !')


hexagons(5)

#hexagons(1)
#hexagons(2)
Challenge - Trust your tribe
✪✪✪ There are n people subdivided in m political parties they vote for. It’s a well known fact that each voter trusts only people who vote for their same party, and of course everybody also trusts him/herself. Given a list groups containing the number of people each group contains, write a function trust(groups) which displays a graph as a list of lists of booleans which shows the trust network among people. For example, trust([2,4,1,3]) must generate a graph where the first
party has two voters, the second party four voters, etc.
if any party has negative people, raise
ValueErrorzero member parties are allowed
For optimal display, use following options:
draw_mat(mat, options={'graph':{'layout':'neato','scale':'1.4'}})
Example:

[9]:
from soft import draw_mat

def trust(groups):
    raise Exception('TODO IMPLEMENT ME !')


trust([2,4,1,3])


#trust([1])
#trust([3,2])
#trust([5,0,3])  # should work
#trust([-1])     # ValueError
Adjacency lists
Challenge - From matrices to adjacency lists
Redo the previous exercises this time using adjacency lists. To draw them, use:
[10]:
from soft import draw_adj
Challenge - Friends
✪✪ In groups of friends, everybody is friend with each other, and often somebody from each group is friend with somebody from another group, forming thus a connection among different communities. Write a function friends which given a list of groups and connections among them, creates a NEW graph and displays it as a dictionary of adjacency lists where each person in a group is linked to all other persons in the group except itself, and groups are connected according to the couple of names specified in connections
DO NOT MODIFY THE INPUT !!!
NOTE: isFriendOf is a symmetrical relation, so you will need two arrows for each couple in connections
for optimal display, use
optionslike this:draw_adj(d, options={'graph':{ 'layout':'neato', 'scale':'1.4'}})
Example:
>>> groups = [ ['Albert','Bart','Carol','Dorothy'],
               ['Edgar','Felix','Grace'],
               ['Harvey','Iris' ,'Lora','Morgan','Norman'] ]
>>> connections = [('Albert','Edgar'), ('Felix','Lora')]

>>> friends(groups, connections)

[11]:
from soft import draw_adj

def friends(groups, connections):
    raise Exception('TODO IMPLEMENT ME !')

groups = [ ['Albert','Bart','Carol','Dorothy'],
           ['Edgar','Felix','Grace'],
           ['Harvey','Iris' ,'Lora','Morgan','Norman'] ]
connections = [('Albert','Edgar'), ('Felix','Lora')]


#friends([ ['A','B','C'], ['D']],[('B','D')])
Challenge - Counter Intelligence
✪✪✪ The secret service has just raided the house of a suspected spy. The foreign agent had left the building few hours before, but while searching the house a microfilm is found with instructions for the spy about the next moves he should do. On the paper, locations are anonymized with words like ‘Alpha’, ‘Bravo’, etc. Supposing names in the text follow a temporal order, the secret service wants you to derive a map of the performed trips, so to show the connections among the various locations. Write a function decode which given the text and a list of locations names, displays a graph as a dictionary of adjacency lists
DO NOT put self-loops in the map
Some words are followed by punctuation, clean them using the provided list
Example:
>>> punctuation = ['.',',']
>>> locations = ['Alfa', 'Bravo', 'Charlie', 'Delta', 'Eagle']
>>> text = """
Go to Bravo, then take a bus to Alfa. Afterwards, go to Charlie
and meet your partner in Eagle. Next day go back to Alfa and later
take a train to Delta. Remain for a day in Delta, then rent a car
and reach Charlie.
"""
>>> decode(text, locations)

[12]:
from soft import draw_adj

def decode(text, locations):
    raise Exception('TODO IMPLEMENT ME !')

punctuation = ['.',',']
locations = ['Alfa', 'Bravo', 'Charlie', 'Delta', 'Eagle']
text = """
Go to Bravo, then take a bus to Alfa. Afterwards, go to Charlie
and meet your partner in Eagle. Next day go back to Alfa and later
take a train to Delta. Remain for a day in Delta, then rent a car
and reach Charlie.
"""


decode(text, locations)

#punctuation, locations = [';','.'], ['Tango', 'Whiskey','Yankee']
#text = "Find Yankee; dance Tango; drink all the Whiskey. Then go find another Yankee with some Whiskey."
#decode(text, locations)
Networkx
We will now see some exercises with NetworkX. To do them, you will need to import the library and relative drawing function:
[13]:
import networkx as nx
from soft import draw_nx
Challenge - Offshore
✪✪ Your government’s Revenue Service has launched an investigation into big tech firms: there is clear evidence they manage to pay almost zero taxes by having a complex network of transactions between a myriad of accounts in offshore tax havens. In order to get a clear picture of what is going on, the Revenue Service asks you to draw a graph showing suspect transactions occurred in a fiscal year among accounts of different countries.
A transaction is a list with four values: the date, the origin and the destination country, and the amount of the transaction (we assume billion dollars as units).
Write a function offshore which takes a list of transactions and displays a Networkx graph showing each of the occurred transactions for a given fiscal year.
this time also RETURN the graph data structure, so to allow some tests with assert
label the transaction without the year and use a month name, like
Jun 26, and place the amount47 B$in a new line. There are many ways to convert to month, you can use a crude ‘do-it-yourself’ solution or using python string formattingREMEMBER to set both
'weight'and'label', which are different things !For optimal display, use
optionslike this:
draw_nx(G, options={'graph':{'size':'8,5!'}, 'edge':{'fontsize':'10'}})
Example:
>>> transactions = [
     ['2018-02-10','Taiwan', 'Cyprus', 30],
     ['2018-02-12','Taiwan', 'Virgin Islands', 83],
     ['2018-02-14','Cayman', 'Cyprus', 34],
     ['2018-03-25','Cayman', 'Bermuda', 143],
     ['2018-03-28','Cyprus', 'Macao', 72],
     ['2018-04-17','Cayman', 'Bermuda', 28],
     ['2019-05-21','Cayman', 'Taiwan', 59],
     ['2019-06-26','Macao',  'Cyprus', 47],
     ['2019-06-29','Taiwan', 'Cayman', 132],
     ['2019-07-02','Macao',  'Taiwan', 149],
     ['2019-08-18','Virgin Islands', 'Taiwan', 72],
     ['2019-09-13','Luxembourg', 'Bermuda', 39],
     ['2019-10-14','Bermuda', 'Luxembourg', 52],
     ['2019-11-20','Bermuda', 'Virgin Islands', 43],
     ['2020-05-20','Virgin Islands', 'Luxembourg', 18],
     ['2020-11-20','Singapore', 'Taiwan', 86],
     ['2020-12-21','Cyprus', 'Luxembourg', 43],
     ['2020-12-22','Bermuda', 'Luxembourg', 13],
]

>>> res = offshore(transactions, 2019)

[14]:
import networkx as nx
from soft import draw_nx

def offshore(transactions, year):
   raise Exception('TODO IMPLEMENT ME !')


transactions = [
     ['2018-02-10','Taiwan', 'Cyprus', 30],
     ['2018-02-12','Taiwan', 'Virgin Islands', 83],
     ['2018-02-14','Cayman', 'Cyprus', 34],
     ['2018-03-25','Cayman', 'Bermuda', 143],
     ['2018-03-28','Cyprus', 'Macao', 72],
     ['2018-04-17','Cayman', 'Bermuda', 28],
     ['2019-05-21','Cayman', 'Taiwan', 59],
     ['2019-06-26','Macao',  'Cyprus', 47],
     ['2019-06-29','Taiwan', 'Cayman', 132],
     ['2019-07-02','Macao',  'Taiwan', 149],
     ['2019-08-18','Virgin Islands', 'Taiwan', 72],
     ['2019-09-13','Luxembourg', 'Bermuda', 39],
     ['2019-10-14','Bermuda', 'Luxembourg', 52],
     ['2019-11-20','Bermuda', 'Virgin Islands', 43],
     ['2020-05-20','Virgin Islands', 'Luxembourg', 18],
     ['2020-11-20','Singapore', 'Taiwan', 86],
     ['2020-12-21','Cyprus', 'Luxembourg', 43],
     ['2020-12-22','Bermuda', 'Luxembourg', 13],
]


res1 = offshore(transactions, 2019)


# weight is different from label !
assert res1['Bermuda']['Luxembourg']['weight'] == 52

#t2 = [ ['2013-01-27','A', 'B', 30],
#       ['2013-12-31','C', 'B', 83],
#       ['2014-12-31','D', 'A', 24] ]
#offshore(t2, 2013)
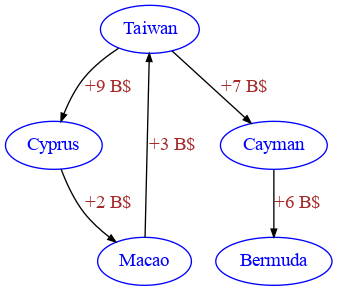
Challenge - Cashflow
✪✪✪ The Revenue Service is interested in knowing the total positive cash flow which went from a country to another country. For example, if there is a transaction of 7 from Cyprus to Macao and another of 5 from Macao to Cyprus, in the resulting graph you should only show one arrow from Cyprus to Macao with the positive difference 2. The order in which you find transactions in the table is not important, the only important thing is to show at most one arrow. For example, if you first
encounter Cayman->Taiwan with 1 and then the reverse Taiwan->Cayman with 8, you will show one arrow Taiwan->Cayman with label ‘+7 B$’
Write a function cash_flow to display a NetworkX graph
this time also RETURN the graph to allow testing with assert
ASSUME all transactions happen in the same fiscal year - here we removed dates as they are not important
DO NOT show zero valued cash flows
HINT: to solve the exercise, you can first start by by summing all transactions which went from one place to another one (like Cayman->Bermuda), without caring about inverse transactions. Having done this, go on and try showing only the positive cash flow
Example:
>>> transactions = [
     ['Taiwan', 'Cyprus', 9],    # only one transaction, shows Taiwan->Cyprus 9
     ['Cayman', 'Bermuda', 4],   # Cayman->Bermuda 4 sums with Cayman->Bermuda 2 total Cayman->Bermuda 6
     ['Cyprus', 'Macao', 7],     # Cyprus->Macao 7 minus Macao->Cyprus 5 total Cyprus->Macao 2
     ['Cayman', 'Bermuda', 2],
     ['Cayman', 'Taiwan', 1],    # Taiwan->Cayman 8 minus Cayman->Taiwan 1 total Taiwan->Cayman 7
     ['Macao',  'Cyprus', 5],
     ['Taiwan', 'Cayman', 8],
     ['Macao',  'Taiwan', 3],
     ['Virgin Islands', 'Curacao', 0],  # zero, don't show
     ['Luxembourg', 'Singapore', 2],     # don't show, total sum with inverse transactions is zero
     ['Singapore', 'Luxembourg', 1],
     ['Singapore', 'Luxembourg', 1]
]
>>> cash_flow(transactions)
[15]:
import networkx as nx
from soft import draw_nx

def cash_flow(transactions):
   raise Exception('TODO IMPLEMENT ME !')


transactions = [
     ['Taiwan', 'Cyprus', 9],    # only one transaction, shows Taiwan->Cyprus 9
     ['Cayman', 'Bermuda', 4],   # Cayman->Bermuda 4 sums with Cayman->Bermuda 2 total Cayman->Bermuda 6
     ['Cyprus', 'Macao', 7],     # Cyprus->Macao 7 minus Macao->Cyprus 5 total Cyprus->Macao 2
     ['Cayman', 'Bermuda', 2],
     ['Cayman', 'Taiwan', 1],    # Taiwan->Cayman 8 minus Cayman->Taiwan 1 total Taiwan->Cayman 7
     ['Macao',  'Cyprus', 5],
     ['Taiwan', 'Cayman', 8],
     ['Macao',  'Taiwan', 3],
     ['Virgin Islands', 'Curacao', 0],  # zero, don't show
     ['Luxembourg', 'Singapore', 2],     # don't show, total sum with inverse transactions is zero
     ['Singapore', 'Luxembourg', 1],
     ['Singapore', 'Luxembourg', 1]
]


res = cash_flow(transactions)


assert res['Cayman']['Bermuda']['weight'] == 6
assert res['Cyprus']['Macao']['weight'] == 2
assert res['Taiwan']['Cayman']['weight'] == 7
assert not res.has_edge('Virgin Islands','Curacao')
assert not res.has_edge('Singapore','Luxembourg')
assert not res.has_edge('Luxembourg','Singapore')