Bus network
Download worked project
In this worked project we will visualize intercity bus network in GTFS format. Original data was split in several files which we merged into dataset network-short.csv.
Data source: dati.trentino.it, MITT service, released under Creative Commons Attribution 4.0 licence.
REQUIREMENTS: Having read Relational data tutorial , which contains also instructions for installing required libraries.

What to do
Unzip exercises zip in a folder, you should obtain something like this:
bus-network-prj
    bus-network.ipynb
    bus-network-sol.ipynb
    soft.py
    jupman.py
WARNING: to correctly visualize the notebook, it MUST be in an unzipped folder !
open Jupyter Notebook from that folder. Two things should open, first a console and then a browser. The browser should show a file list: navigate the list and open the notebook
bus-network.ipynbGo on reading the notebook, and write in the appropriate cells when asked
Shortcut keys:
to execute Python code inside a Jupyter cell, press
Control + Enterto execute Python code inside a Jupyter cell AND select next cell, press
Shift + Enterto execute Python code inside a Jupyter cell AND a create a new cell aftwerwards, press
Alt + EnterIf the notebooks look stuck, try to select
Kernel -> Restart
Introduction
To visualize data, we will use networkx library. Let’s first see an example on how to do it:
[2]:
import networkx as nx
from soft import draw_nx
Gex = nx.DiGraph()
# we can force horizontal layout like this:
Gex.graph['graph']= {
'rankdir':'LR',
}
# When we add nodes, we can identify them with an identifier like the
# stop_id which is separate from the label, because in some unfortunate
# case two different stops can share the same label.
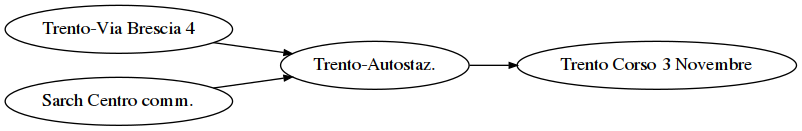
Gex.add_node('1', label='Trento-Autostaz.',
color='black', fontcolor='black')
Gex.add_node('723', label='Trento-Via Brescia 4',
color='black', fontcolor='black')
Gex.add_node('870', label='Sarch Centro comm.',
color='black', fontcolor='black')
Gex.add_node('1180', label='Trento Corso 3 Novembre',
color='black', fontcolor='black')
# IMPORTANT: edges connect stop_ids , NOT labels !!!!
Gex.add_edge('870','1')
Gex.add_edge('723','1')
Gex.add_edge('1','1180')
# function defined in sciprog.py :
draw_nx(Gex)
Colors and additional attributes
Since we have a bus stop netowrk, we might want to draw edges according to the route they represent. Here we show how to do it only with the edge from Trento-Autostaz to Trento Corso 3 Novembre:
[3]:
# we can retrieve an edge like this:

edge = Gex['1']['1180']

# and set attributes, like these:

edge['weight'] = 5                # it takes 5 minutes to go from Trento-Autostaz
                                  # to Trento Corso 3 Novembre
edge['label'] = str(5)            # the label is a string

edge['color'] = '#2ca02c'         # we can set some style for the edge, such as color
edge['penwidth']= 4               # and thickness

edge['route_short_name'] = 'B301' # we can add any attribute we want,
                                  # Note these custom ones won't show in the graph


draw_nx(Gex)

To be more explicit, we can also add a legend this way:
[4]:
draw_nx(Gex, [{'color': '#2ca02c', 'label': 'B211'}])

[5]:
# Note an edge is a simple dictionary:
print(edge)
{'weight': 5, 'label': '5', 'color': '#2ca02c', 'penwidth': 4, 'route_short_name': 'B301'}
load_stops
To load network-short.csv, we provide this function:
[6]:
def load_stops():
    """Loads file data and RETURN a list of dictionaries with the stop times
    """

    import csv
    with open('network-short.csv', newline='', encoding='UTF-8') as csvfile:
        reader = csv.DictReader(csvfile)
        lst = []
        for d in reader:
            lst.append(d)
    return lst
[7]:
stops = load_stops()

#IMPORTANT: NOTICE *ALL* VALUES ARE *STRINGS*  !!!!!!!!!!!!

stops[0:2]
[7]:
[OrderedDict([('', '3'),
              ('route_id', '76'),
              ('agency_id', '12'),
              ('route_short_name', 'B202'),
              ('route_long_name',
               'Trento-Sardagna-Candriai-Vaneze-Vason-Viote'),
              ('route_type', '3'),
              ('service_id', '22018091220190621'),
              ('trip_id', '0002402742018091220190621'),
              ('trip_headsign', 'Trento-Autostaz.'),
              ('direction_id', '0'),
              ('arrival_time', '06:27:00'),
              ('departure_time', '06:27:00'),
              ('stop_id', '5025'),
              ('stop_sequence', '4'),
              ('stop_code', '2620VE'),
              ('stop_name', 'Sardagna Civ.20'),
              ('stop_desc', ''),
              ('stop_lat', '46.073125'),
              ('stop_lon', '11.093579'),
              ('zone_id', '2620.0')]),
 OrderedDict([('', '4'),
              ('route_id', '76'),
              ('agency_id', '12'),
              ('route_short_name', 'B202'),
              ('route_long_name',
               'Trento-Sardagna-Candriai-Vaneze-Vason-Viote'),
              ('route_type', '3'),
              ('service_id', '22018091220190621'),
              ('trip_id', '0002402742018091220190621'),
              ('trip_headsign', 'Trento-Autostaz.'),
              ('direction_id', '0'),
              ('arrival_time', '06:28:00'),
              ('departure_time', '06:28:00'),
              ('stop_id', '843'),
              ('stop_sequence', '5'),
              ('stop_code', '2620MS'),
              ('stop_name', 'Sardagna-Maso Scala'),
              ('stop_desc', ''),
              ('stop_lat', '46.069871'),
              ('stop_lon', '11.097749'),
              ('zone_id', '2620.0')])]
1. extract_routes
Implement a function that extracts all route_short_name from the stops list and RETURNs an alphabetically sorted list of them, without duplicates (see example)
Example:
>>> stops = load_stops()
>>> extract_routes(stops)
['B201', 'B202', 'B211', 'B217', 'B301']
[8]:
import networkx as nx
from soft import draw_nx

def extract_routes(stps):
    raise Exception('TODO IMPLEMENT ME !')

extract_routes(stops)
2. to_int_min
Implement a function that takes a time string in the format like 08:27:42 and RETURN the time since midnight in minutes, ignoring the seconds (es 507)
[9]:
def to_int_min(time_string):
    raise Exception('TODO IMPLEMENT ME !')
to_int_min('08:27:42')
3. get_legend_edges
If you have n routes numbered from 0 to n-1, and you want to assign to each of them a different color, we provide this function:
[10]:
def get_color(i, n):
    """ RETURN the i-th color chosen from n possible colors, in
        hex format (i.e. #ff0018).

        - if i < 0 or i >= n, raise ValueError
    """
    if n < 1:
        raise ValueError("Invalid n: %s" % n)
    if i < 0 or i >= n:
        raise ValueError("Invalid i: %s" % i)

    #HACKY, just for matplotlib < 3
    lst = ['#1f77b4',
         '#ff7f0e',
         '#2ca02c',
         '#d62728',
         '#9467bd',
         '#8c564b',
         '#e377c2',
         '#7f7f7f',
         '#bcbd22',
         '#17becf']

    return lst[i % 10]
[11]:
get_color(4,5)
[11]:
'#9467bd'
Now implement a function that RETURNs a list of dictionaries, where each dictionary represent a route with label and associated color. Dictionaries are in the order returned by extract_routes() function.
Example:
>>> get_legend_edges()
[{'label': 'B201', 'color': '#1f77b4'},
 {'label': 'B202', 'color': '#ff7f0e'},
 {'label': 'B211', 'color': '#2ca02c'},
 {'label': 'B217', 'color': '#d62728'},
 {'label': 'B301', 'color': '#9467bd'}]
[12]:
def get_legend_edges():
    raise Exception('TODO IMPLEMENT ME !')

get_legend_edges()
4. calc_nx
Implement function calc_nx which RETURN a NetworkX DiGraph representing the bus stop network
To keep things simple, we suppose routes NEVER overlap (no edge is ever shared by two routes), so we need only a DiGraph and not a MultiGraph
as label for nodes, use the stop_name, and try to format it nicely.
as
'weight'for the edges, use the time in minutes between one stop and the next oneas custom property, add
route_short_nameas
'color'for the edges, use the color given by providedget_color(i,n)functionas
'penwidth'for edges, set4
IMPORTANT: notice stops are already ordered by arrival_time, this makes it easy to find edges !
HINT: to make sure you’re on the right track, try first to represent one single route, like B202
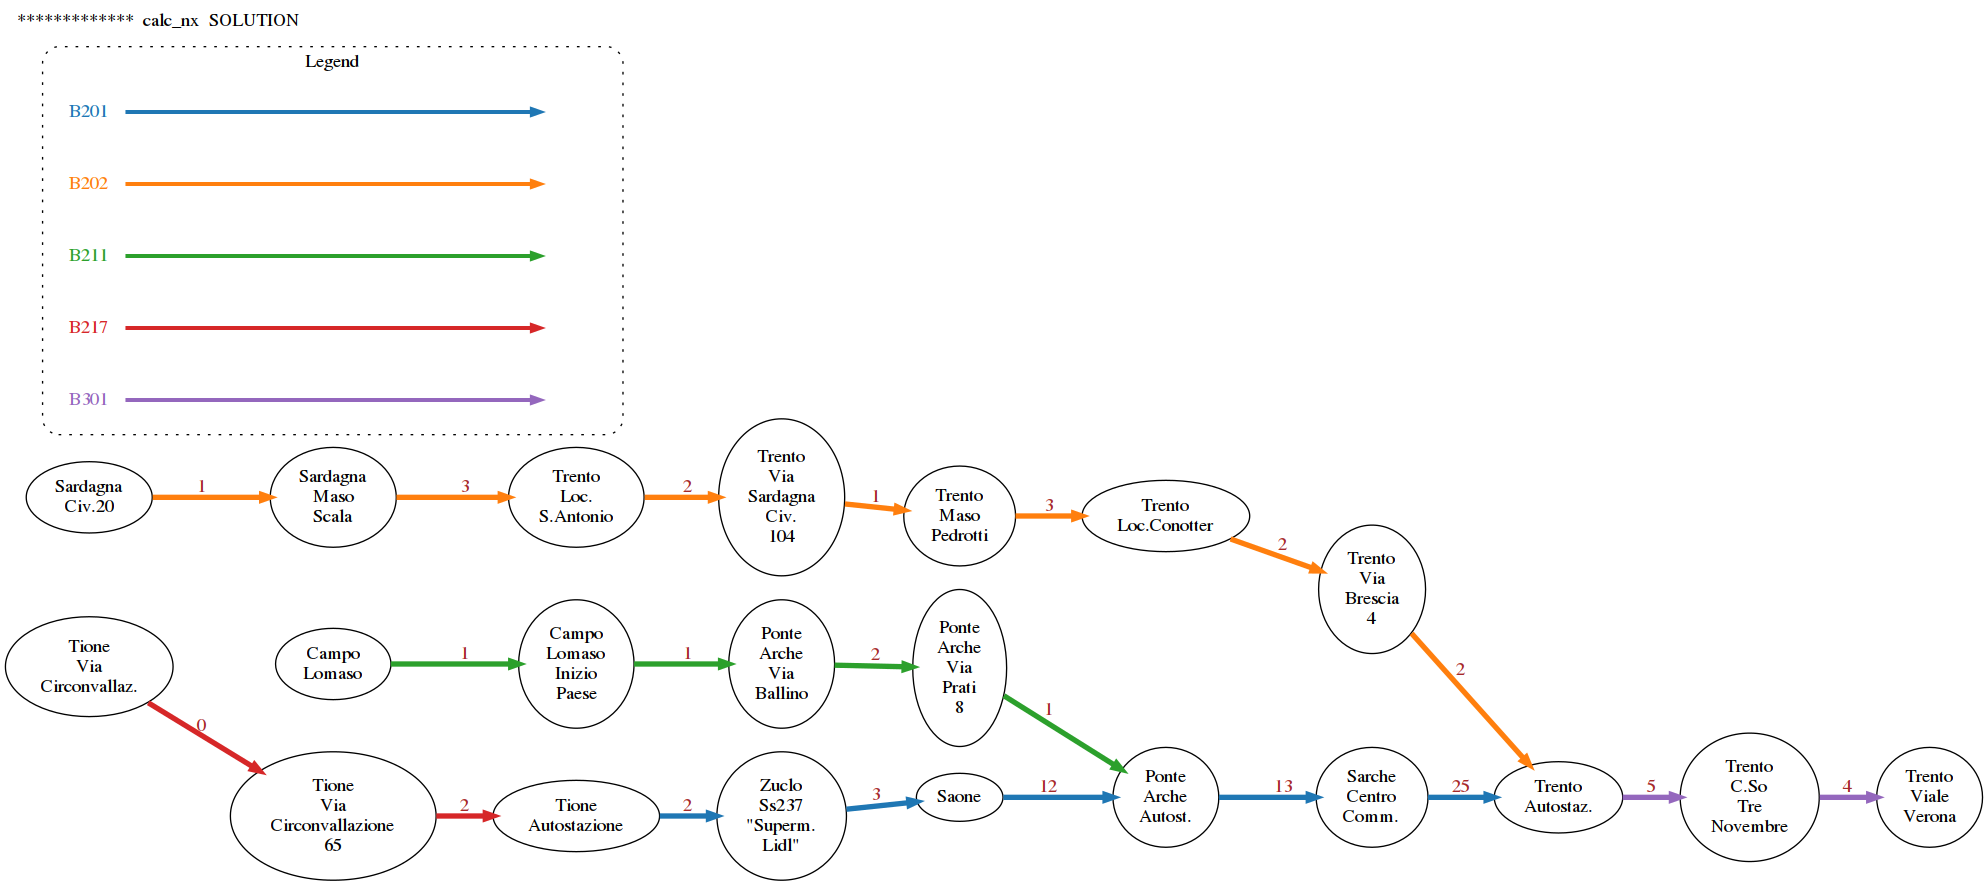
[13]:
def calc_nx(stops):
    raise Exception('TODO IMPLEMENT ME !')

G = calc_nx(stops)

draw_nx(G, get_legend_edges(),

)
5. Hubs
A hub is a node that allows to switch route, that is, it is touched by at least two different routes.
For example, Trento-Autostaz is touched by three routes, which is more than one, so it is a hub. Let’s examine the node - we know it has stop_id='1':
[14]:
G.node['1']
[14]:
{'label': 'Trento\nAutostaz.', 'color': 'black', 'fontcolor': 'black'}
If we examine its in_edges, we find it has incoming edges from stop_id '723' and '870', which represent respectively Trento Via Brescia and Sarche Centro Commerciale :
[15]:
G.in_edges('1')
[15]:
InEdgeDataView([('870', '1'), ('723', '1')])
If you get a View object, if needed you can easily transform to a list:
[16]:
list(G.in_edges('1'))
[16]:
[('870', '1'), ('723', '1')]
[17]:
G.node['723']
[17]:
{'label': 'Trento\nVia\nBrescia\n4', 'color': 'black', 'fontcolor': 'black'}
[18]:
G.node['870']
[18]:
{'label': 'Sarche\nCentro\nComm.', 'color': 'black', 'fontcolor': 'black'}
There is only an outgoing edge toward Trento Corso 3 Novembre :
[19]:
G.out_edges('1')
[19]:
OutEdgeDataView([('1', '1108')])
[20]:
G.node['1108']
[20]:
{'label': 'Trento\nC.So\nTre\nNovembre',
 'color': 'black',
 'fontcolor': 'black'}
If, for example, we want to know the route_id of this outgoing edge, we can access it this way:
[21]:
G['1']['1108']
[21]:
{'weight': 5,
 'label': '5',
 'route_short_name': 'B301',
 'color': '#9467bd',
 'penwidth': 4}
If you want to change the color attribute of the node '1', you can write like this:
[22]:
G.node['1']['color'] = 'red'
G.node['1']['fontcolor'] = 'red'
Implement color_hubs
Implement a function which prints the hubs in the graph G as text, and then draws the graph with the hubs colored in red.
NOTE: you don’t need to recalculate the graph, just set the relevant nodes color to red
Example:
>>> color_hubs(G)
SOLUTION: The hubs are:

stop_id:757
Tione
Autostazione

stop_id:742
Ponte
Arche
Autost.

stop_id:1
Trento
Autostaz.


[23]:
def color_hubs(G):

    raise Exception('TODO IMPLEMENT ME !')


color_hubs(G)
6. plot_timings
To extract bus times from G, use this:
[24]:
G.edges()
[24]:
OutEdgeView([('757', '746'), ('746', '857'), ('857', '742'), ('742', '870'), ('870', '1'), ('1', '1108'), ('5025', '843'), ('843', '842'), ('842', '3974'), ('3974', '841'), ('841', '881'), ('881', '723'), ('723', '1'), ('1556', '4392'), ('4392', '4391'), ('4391', '4390'), ('4390', '742'), ('829', '3213'), ('3213', '757'), ('1108', '1109')])
If you get a View, you can iterate through the sequence like it were a list
To get the data from an edge, you can use this:
[25]:
G.get_edge_data('1','1108')
[25]:
{'weight': 5,
 'label': '5',
 'route_short_name': 'B301',
 'color': '#9467bd',
 'penwidth': 4}
Now implement the function plot_timings, which given a networkx DiGraph G plots a frequency histogram of the time between bus stops.
Expected output:

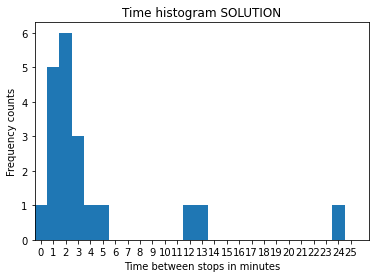
[26]:
def plot_timings(G):
    raise Exception('TODO IMPLEMENT ME !')

plot_timings(G)